
Posts by LKI Consulting
The fathers of spectroscopy, a series: Sir William Herschel
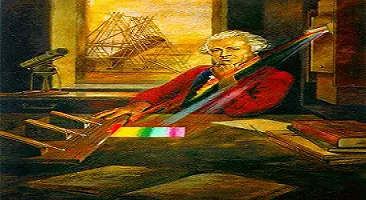
Spectroscopy is the study of the absorption, reflectance, and emission of electromagnetic radiation (e.g., light) by matter, measured as a function of wavelength (or frequency). It is used as a tool for characterizing the structures of atoms and molecules by exploiting the fact that they absorb frequencies that are characteristic of their structure. Readers, while…
Read MoreOrientation Survey: pXRF
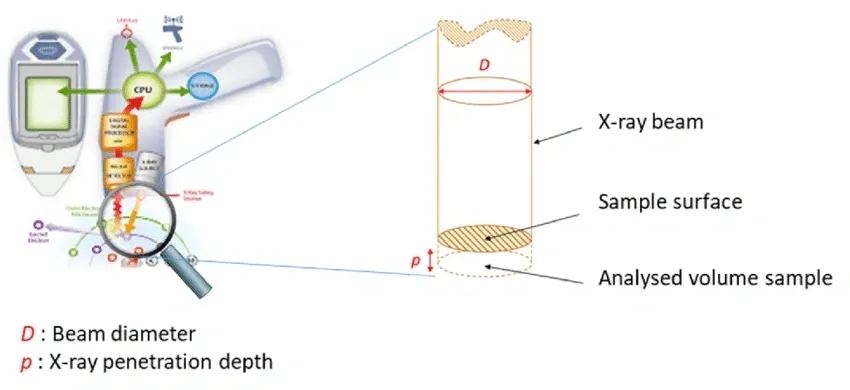
pXRF has many applications both within and outside of mining and mineral exploration. In no industry has a vendor ever told a client to take the pXRF, point, shoot, and voilà – you now have a robust dataset that is ready for analysis. This post both builds on our prior pXRF post (where we talked about QA/QC)…
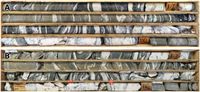
Read MoreOrientation Surveys: Rocks
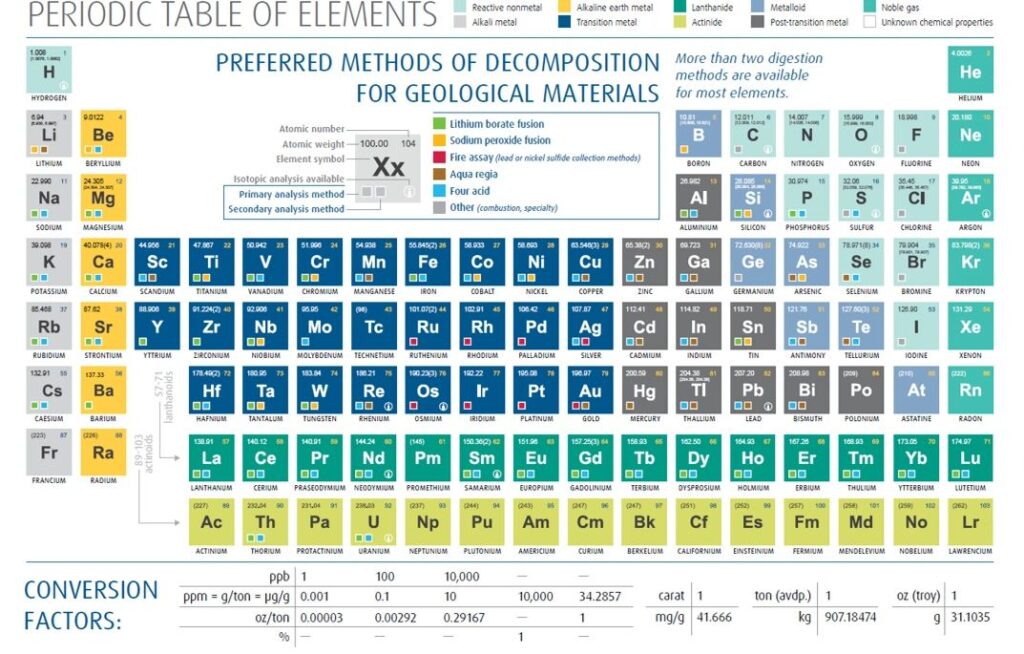
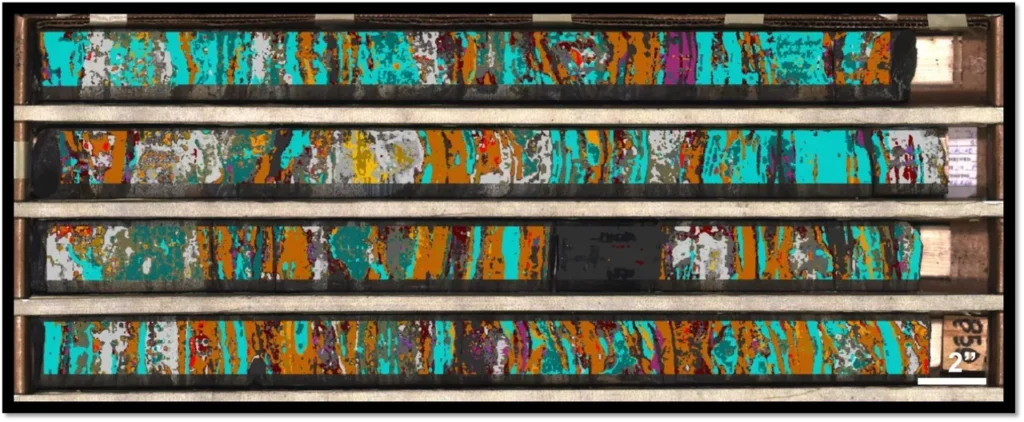
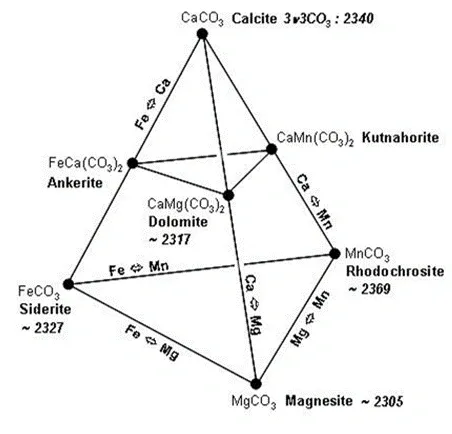
Perhaps a bit unconventional for these blog posts, but I want this to revolve front and center around this amazing resource I found from ALS Labs in the depths of my hard drive… a periodic table of the elements that contains information about the types of digestions required to liberate each element (note that photon assay is…
Read MoreOrientation Study: Residual Soil Geochemistry
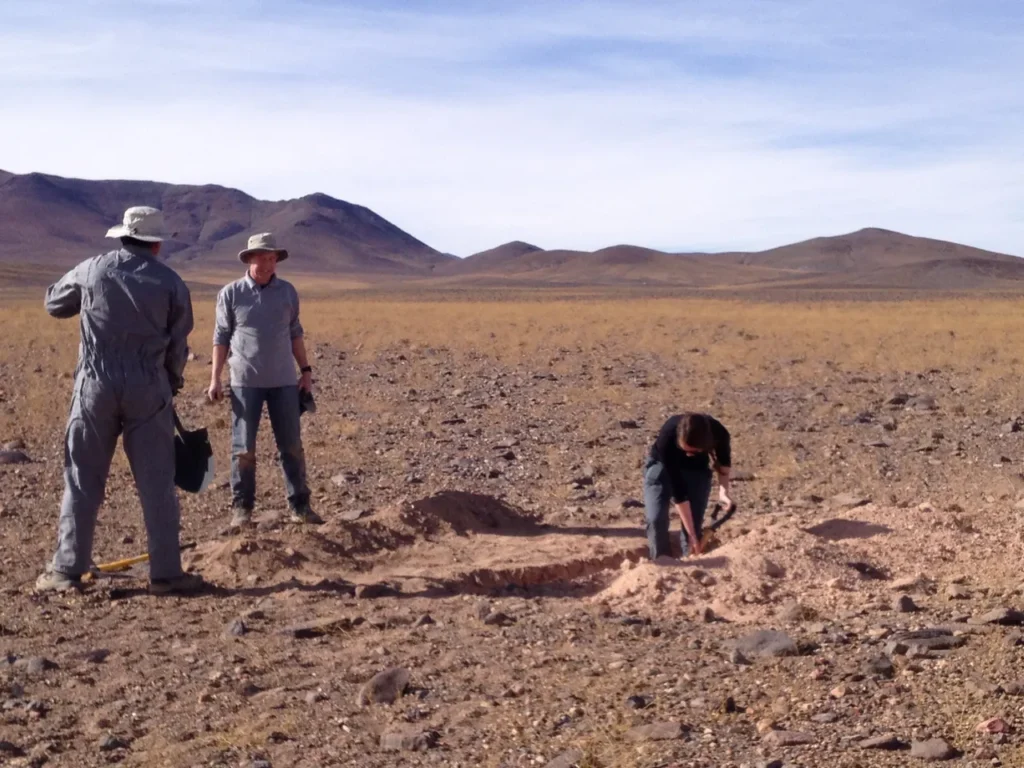
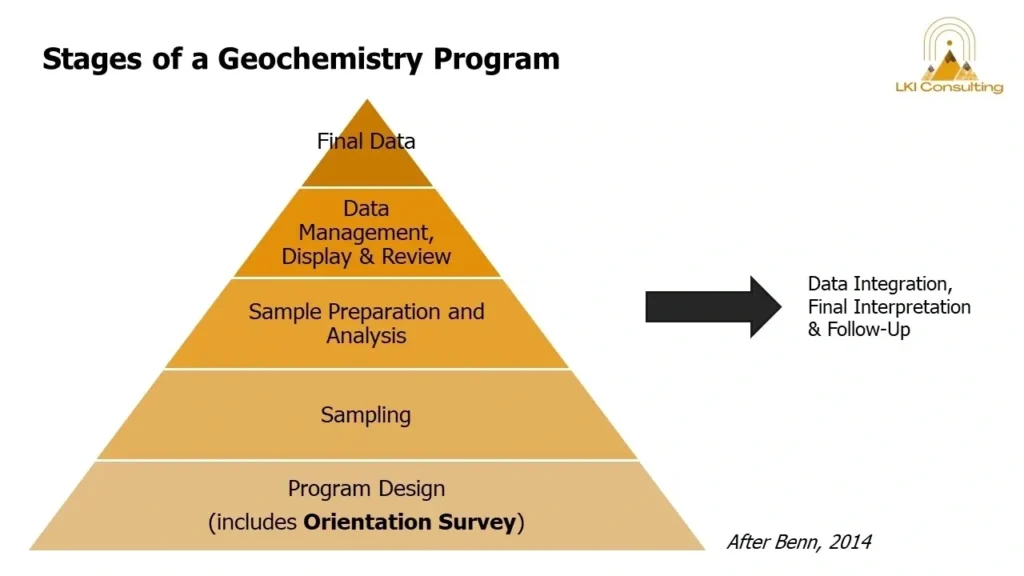
As discussed in our first installment, orientation studies should enable the selection of optimum field, laboratory and interpretation procedures. Ideally, these procedures should allow for the clear resolution of significant anomalous patterns, with as little overlap as possible between anomalous and background populations. Below is a list of some of the most important factors that…
Read MoreJanuary: A Month of Orientation Surveys
Orientation survey. Of course you *should* know what this term means… you think to yourself… Stop googling for half baked answers and stay tuned this January to our blog, where we are going to break down this term and show you how to put together some really simple programs that will ultimately return value to…
Read MorepXRF & QA/QC
Haven’t conducted a pXRF program in awhile? No worries, this post has you covered… to remind you to never ever forget to calibrate your equipment. Like any geochemical program, you’re also going to need to setup a rigorous QA/QC program complete with standards (matrix-matched certified reference material), blanks (pure quartz) and duplicates. QA/QC Theory Successful…
Read MoreSpectralucation July: Beyond Porphyry-Epithermal
A common comment that we receive is that ‘spectral is great for porphyry and epithermal, but it cannot help with other deposits.’ At LKI Consulting, we wholeheartedly disagree with this statement so for our last Spectralucation July post we would like to debunk some myths and explore the range of deposit types that are seen…
Read MoreSpectralucation July: Using Spectral Composition Data
If you are unaware, hyperspectral data is renown for producing mineral data; biotite, white mica, tourmaline, sulfates, carbonates, Fe-oxides… the list is long and diverse. However, spectral datasets also yield “composition” data, namely crystallinity and wavelength data. In this post we’re going to focus on some of the more common features and mineral groups they…
Read MoreSpectralucation July: Why Are Plants Green
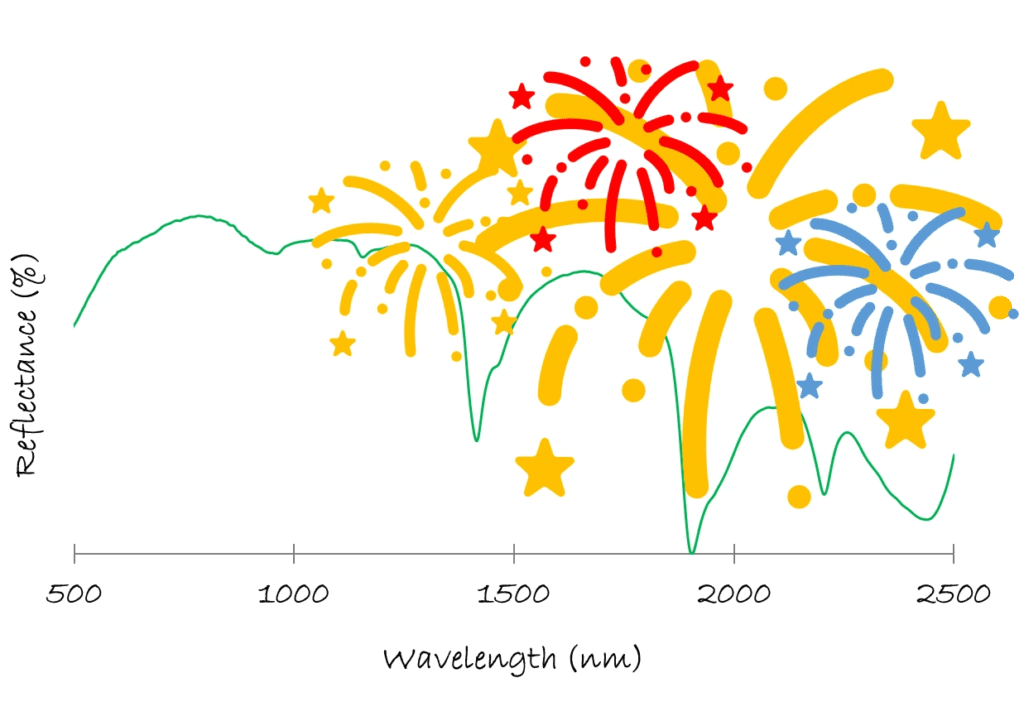
Fig. 1. Montmorillonite spectra celebrating Spectalucation July. The y-axis is reflectance (%) and the x-axis is wavelength (nm). Our blog posts thus far have concentrated more on geochemistry and general themes so we thought for July… let’s get into some spectral topics to break up either the extreme heat that we’re feeling at our home…
Read MoreElectrochemistry & Invisible Gold in Pyrite
Although characteristic of Carlin-type deposits, invisible Au in pyrite is also observed in epithermal (low- and high-sulfidation) and porphyry deposits. Some famous examples include Yanacocha (Peru), Pueblo Viejo (Dominican Republic), Brucejack (Canada), Lihir (Papua New Guinea), and Dexing (China). Perhaps most interestingly… invisible Au has also been found in the epithermal system at the active…
Read More