Accurate and consistent mineralogy is one of the fundamental building blocks of exploration. The explorationist talks and dreams about discovery – in order to do this, they must define vectors towards mineralization, while simultaneously de-risking and increasing the net present value (NPV) of a project. The interpretation of hyperspectral data (i.e. absolute mineral identification, compositional and crystallographic information) aids in alteration zone delineation and mineral chemistry vectoring, as well as facilitating important geotechnical and geometallurgical applications, including improving geological models and sub-models, e.g. alteration and geometallurgical models.Â
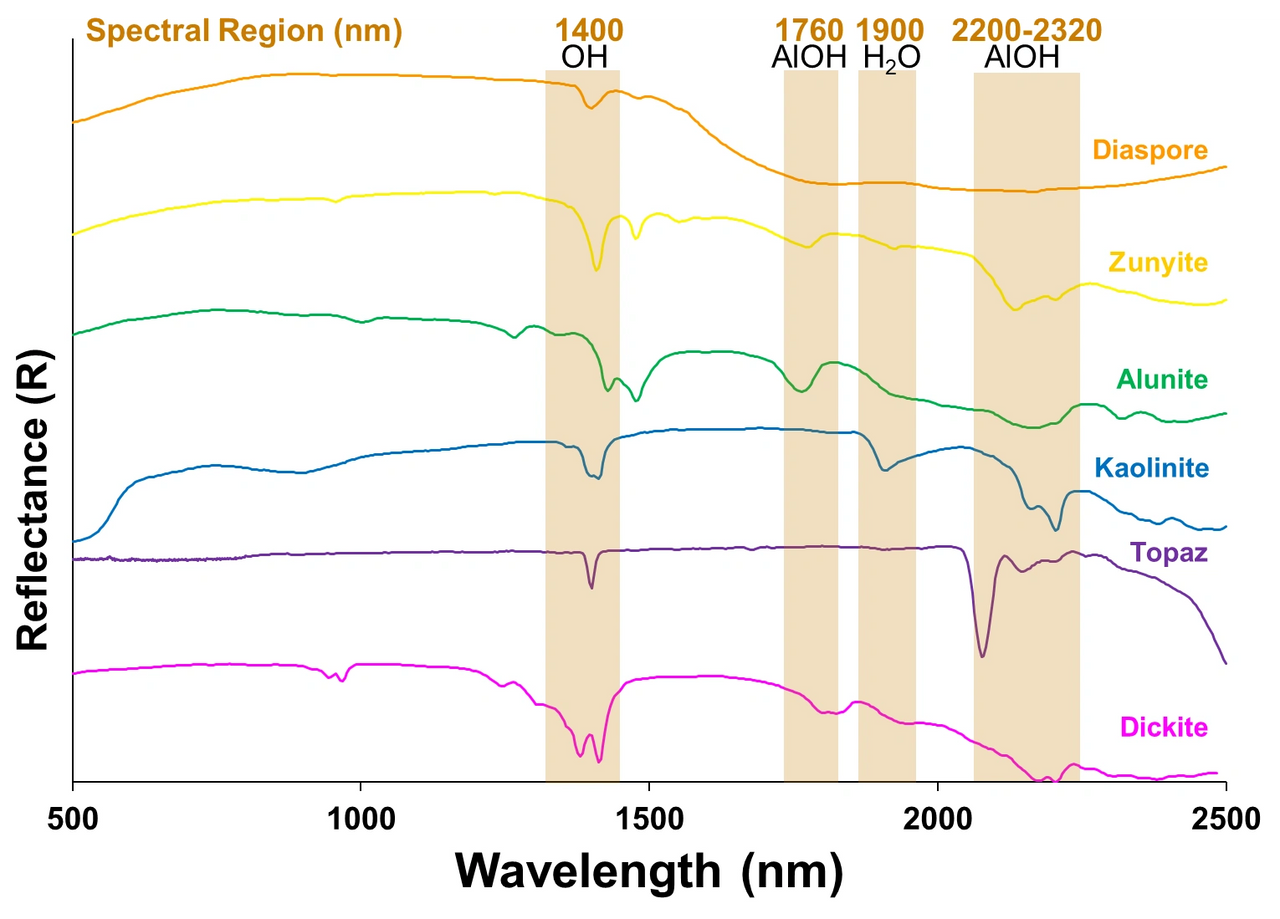
Geologists at heart are simple creatures, requiring a combination of facts and observations to draw complex conclusions; it is our greatest strength. The mineralogical grey zone is the interpretation of minerals using the hand lens versus the accurate and consistent identification of minerals using a range of instrumentation. The wide array of hyperspectral tools available is of interest to geologists because the output is the accurate identification of minerals (Fig. 1), collected relatively cheaply over a large number of samples and/or a large spatial area.

The Spectral Ecosystem
The spectral ecosystem is a feedback loop whereby both multi-spectral and hyperspectral tools at all scales can be used in conjunction with one another to support all types of surveys. These tools range from airborne and satellite systems (e.g. HyMap, AISA, AVIRIS, Landsat, Worldview-3, etc.) to point data (e.g. PIMA, Terraspec, Ore Express), line systems (e.g. HyLogger), and core imaging (e.g. Corescan, Sisurock, HySpex). In selecting the appropriate instrument for a survey, it is important to recall that price is only one factor to consider. Questions to improve study results include spectral and spatial resolution, spectral range/number of bands, swath width, signal to noise, calibration, and scanning formats. Considerations to take into account include the alteration minerals of interest, size of a deposit footprint as well as location, required turnaround time, and how the data will ultimately be used.
An Example Program
At this point, I think those that are still reading are sufficiently intrigued to wonder the how’s:
How do we use the accurate identification of minerals to vector to ore and de-risk exploration programs?
It starts with asking specific questions to design a fit-for-purpose survey… in other words, the basics.
For example: as Sam, the project geologist for a greenfields program, I would structure my program the following way (excuse the oversimplifications please):
- Hyperspectral airborne survey (sampling wavelength ranges from the visible into at least the shortwave (~450-2500nm) and potentially into longer wavelengths depending on application (>3000nm), 10-20nm bandwidths totaling at least over ~100 continuous bands and average SNR of 2000:1 or higher)
- Chip samples of available outcrops and/or soils from a carefully planned survey analyzed with point spectroscopy and/or hyperspectral core imaging for maximum mineralogical information (i.e., in comparison to point spectroscopy, using core imaging provides upwards of ~20,000 pixels of mineralogical information for a single 2×4 cm chip compartment at 250um spatial resolution, <2nm bandwidth in over 1000 continuous bands – contact all providers for more information!)
- Use the results of the core imaging study to refine the results of the airborne survey; this includes a more complete and accurate spectral library as well as a more holistic understanding of mineralogical spatial variation at surface and at depth.
- Vertically integrate the results of the airborne study with complementary geophysical, geomorphological, geological, and geochemical results from the same study area… there’s a lot of avenues that you can pursue to do this! One idea is to use machine learning to output a probability model to explore for non-mapped exposures of lithologies of interest in outcrop or regolith, as well as identify areas that have been misclassified.
- In the case of successful target delineation, I would continue to use hyperspectral to not only help delineate the ore body, but also to identify potential metallurgical and other downstream mineralogical issues.
Making More Informed Decisions by Knowing Your Rocks Better
In lieu of closing remarks, I would like to leave the reader with the following thoughts: we have entire departments within mining companies and investment houses to define the internal rate of return throughout the MVC; why is it that these numbers are squeezed consistently, but without thought that perhaps the best way to capitalize is to collect more information about the rocks themselves to make better decisions? In other words, why are mining companies so slow to join the 4D model revolution that the petroleum industry has been embedded in for at least the past 20 years and why aren’t finance houses demanding the most quantitative models possible? Yes we need the data, but we also require experts to integrate the data.