In comparison to their more shiny (and valuable) mineral counterparts, gangue mineralogy tends to be unloved by geologists. In our rush to define grade for market releases, we lose sight of the fact that gangue mineralogy impacts our final product (i.e., mines) dramatically.
What is gangue in CAPEX and OPEX terms? Gangue minerals are the commercially valueless minerals that surround, or are intermixed with, the mineral(s)/metal(s) of interest in an ore deposit. For example, phyllosilicate “clay” minerals are common gangue minerals that have significant impacts on all aspects of mineral processing:
- In the development stage they can impact ground support and infrastructure;
- During mining they can impact blasting and caving behavior;
- During comminution they can affect crushing and grinding, liberation, and throughput;
- For recovery they can impact flotation, gravity and magnetic separation, and leaching;
- In mine waste and tailings they can have impacts on dewatering, acid neutralization, and reclamation.
Returning to the issue at hand, phyllosilicates are not only difficult to distinguish visually (e.g., during core logging), but they are also difficult to distinguish with geochemistry alone. Furthermore, techniques like MLA and XRD also struggle to quantify some phyllosilicate mineralogy. However, integrating hyperspectral datasets with geochemistry assists with distinguishing clay species (Fig. 1).

Integrating geochemistry and hyperspectral data, a porphyry copper example:
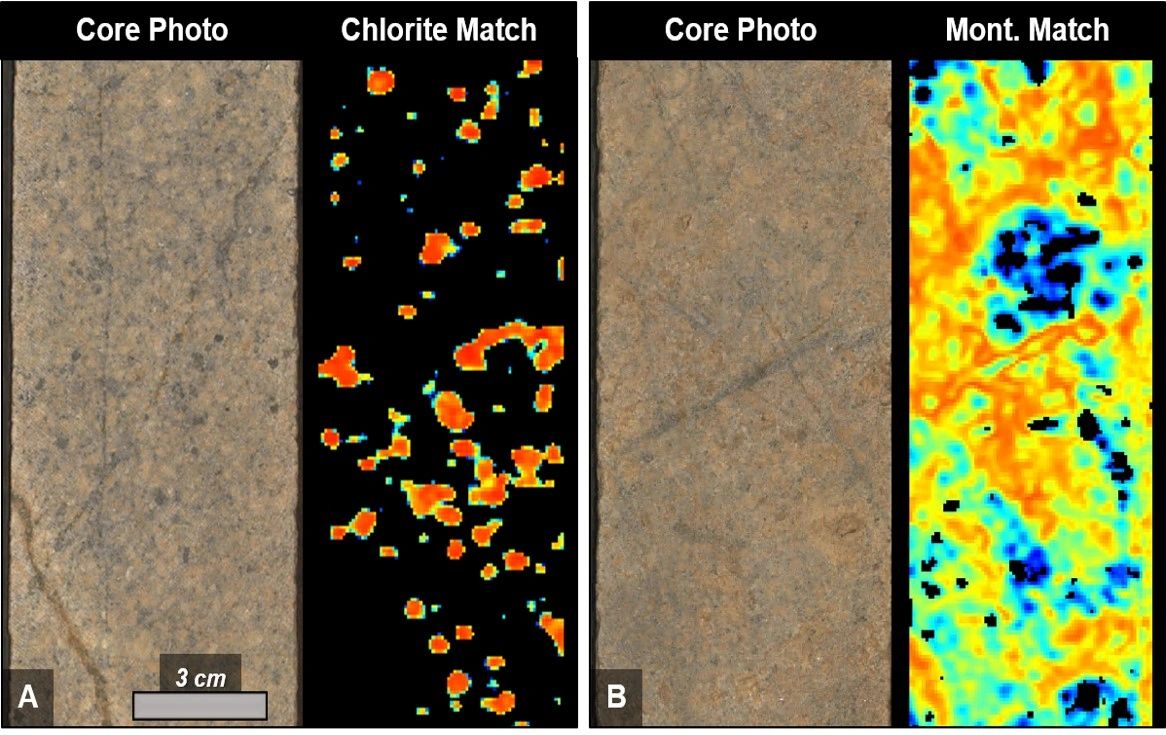
Porphyry copper deposits are long-lived systems, their grades improved by multiple magmatic-hydrothermal events. In these systems, it is not uncommon to find superimposed alteration (and mineralization) events. For instance, potassic zones tend to show at least some degree of overprinting by later hydrothermal fluids until the entire system has cooled to ambient temperature. Our experience looking at hyperspectral data for many years illustrates that it is common for this zone to be riddled with retrograde chlorite and late stage clay alteration (e.g., montmorillonite) – two potential geometallurgical issues (Fig. 2).

To the naked eye, the montmorillonite is not clear, although the chlorite can be detected particularly at the edges of biotite and hornblende crystals. However, geological models capture this zone as the potassic zone, when from the point of view of metallurgy and mineral processing it is essential to record the presence and intensity of the phyllosilicate mineralogy because the overprinting will modify the physical rock properties (e.g., hardness, grindability), and may affect performance in the floatation circuit.
In terms of identifying mineralogy from whole rock geochemistry, it is limited in its ability to identify porphyry minerals such as biotite, pyrophyllite, dickite, kaolinite, and chlorite, while VNIR-SWIR (near visible and short wave infrared) hyperspectral struggles to identify minerals including feldspars. The degree of mixing and alteration intensity is also very clear in geochemical data. It is for reasons such as these that the availability of the two datasets and their successful integration is powerful for your projects.
Unfortunately… there’s no formula:
Unfortunately, there is no formula for integrating hyperspectral and geochemistry data (Fig. 2). Knowledge of the two branches of science / technology is essential, talking to other geoscientists about their experiences and a little creativity will go a long way towards making inroads in your own dataset.