
Posts by LKI Consulting
Geometallurgy: Penalties and Credits
Blog miniseries along common themes are the best! Through the end of 2023 we are going to dive into geometallurgy from a geochemistry-adjacent perspective (keeping it simple, keeping it relevant, and hoping every geoscientist learns one small thing per blog). The most important thing to remember as we start out is that despite what you…
Read MoreThe fathers of spectroscopy, a series: Albert Einstein
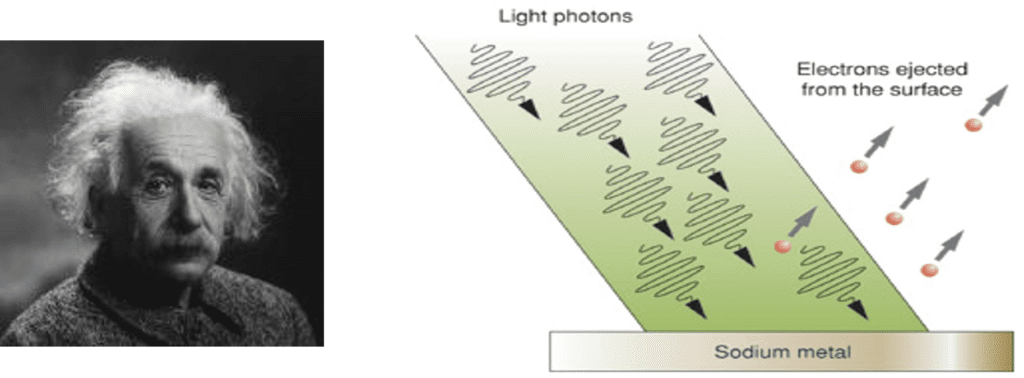
We started off this series with a glass prism and the creation of the visible spectrum (Herschel) and since progressed through theories of light behaving as a wave and light (Maxwell) behaving as a particle (Planck). Now, let’s conclude our series on the fathers of spectroscopy by talking about Albert Einstein and the Photoelectric Effect.…
Read MoreThe fathers of spectroscopy, a series: Max Planck
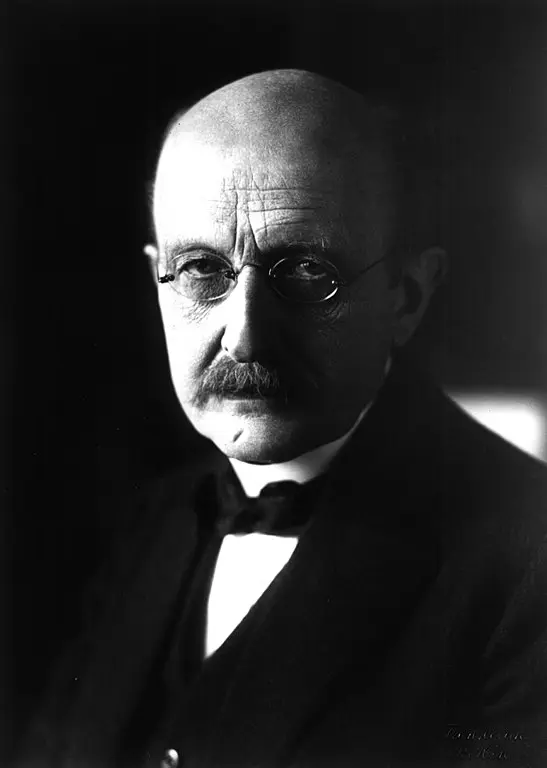
Of the many substantial contributions to theoretical physics, Max Karl Ernst Ludwig Planck’s fame rests heavily on his role as the originator of quantum theory, which revolutionized human understanding (and Marvel movie subplots) of atomic and subatomic processes. The discovery of energy quanta won him the Nobel Prize in Physics in 1918. To add a…
Read MoreThe fathers of spectroscopy, a series: James Clerk Maxwell
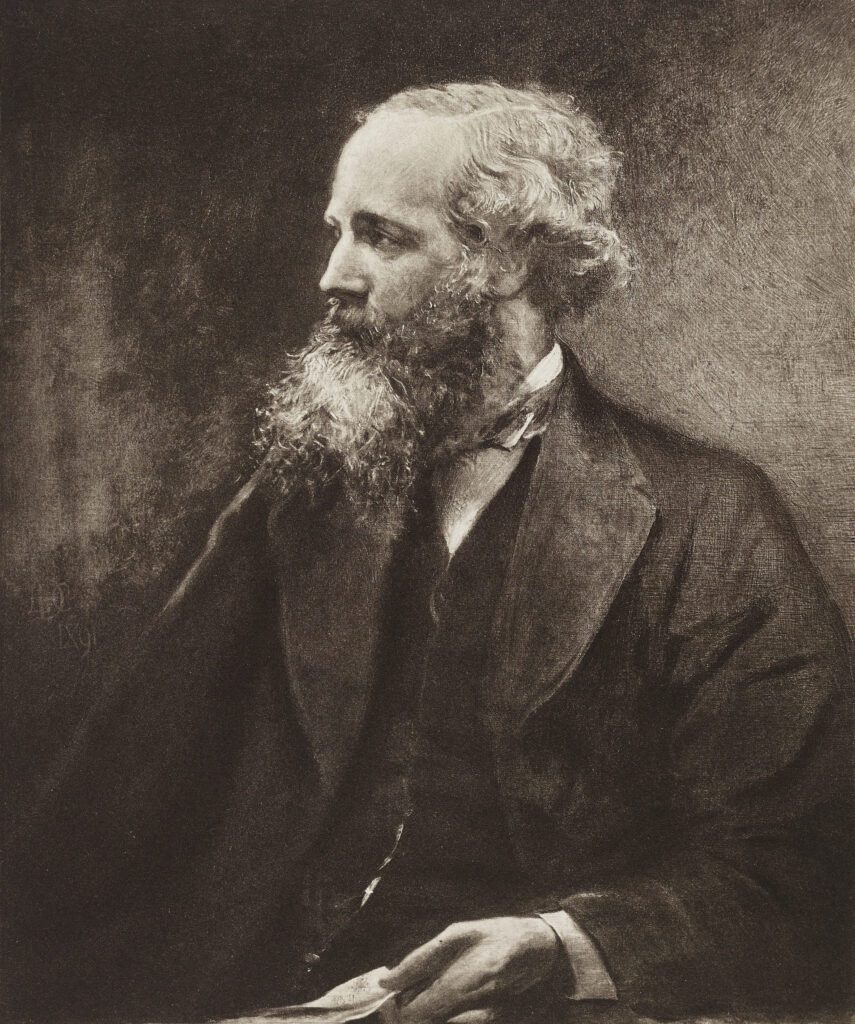
Last post we covered the foundation for which spectroscopy was built, the work of Sir William Herschel, who discovered the infrared through his experiments. Continuing our journey, James Clerk Maxwell was a Scottish mathematician and scientist responsible for the classical theory of electromagnetic (EM) radiation, which was the first theory to describe electricity, magnetism, and…
Read MoreThe fathers of spectroscopy, a series: Sir William Herschel
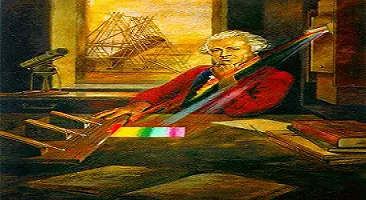
Spectroscopy is the study of the absorption, reflectance, and emission of electromagnetic radiation (e.g., light) by matter, measured as a function of wavelength (or frequency). It is used as a tool for characterizing the structures of atoms and molecules by exploiting the fact that they absorb frequencies that are characteristic of their structure. Readers, while…
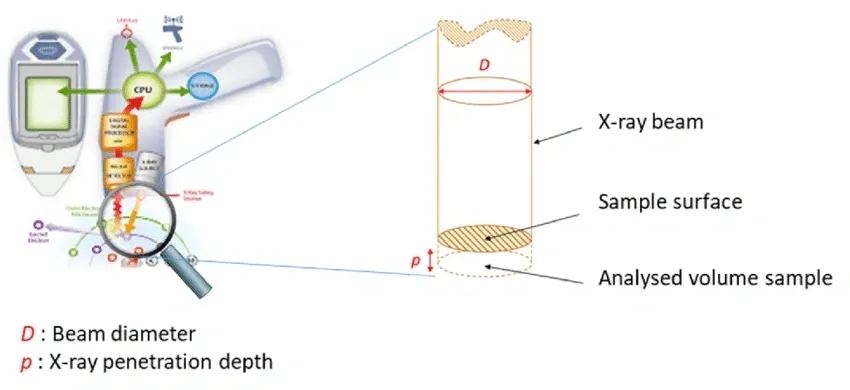
Read MoreOrientation Survey: pXRF
pXRF has many applications both within and outside of mining and mineral exploration. In no industry has a vendor ever told a client to take the pXRF, point, shoot, and voilà – you now have a robust dataset that is ready for analysis. This post both builds on our prior pXRF post (where we talked about QA/QC)…
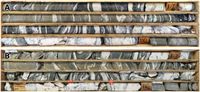
Read MoreOrientation Surveys: Rocks
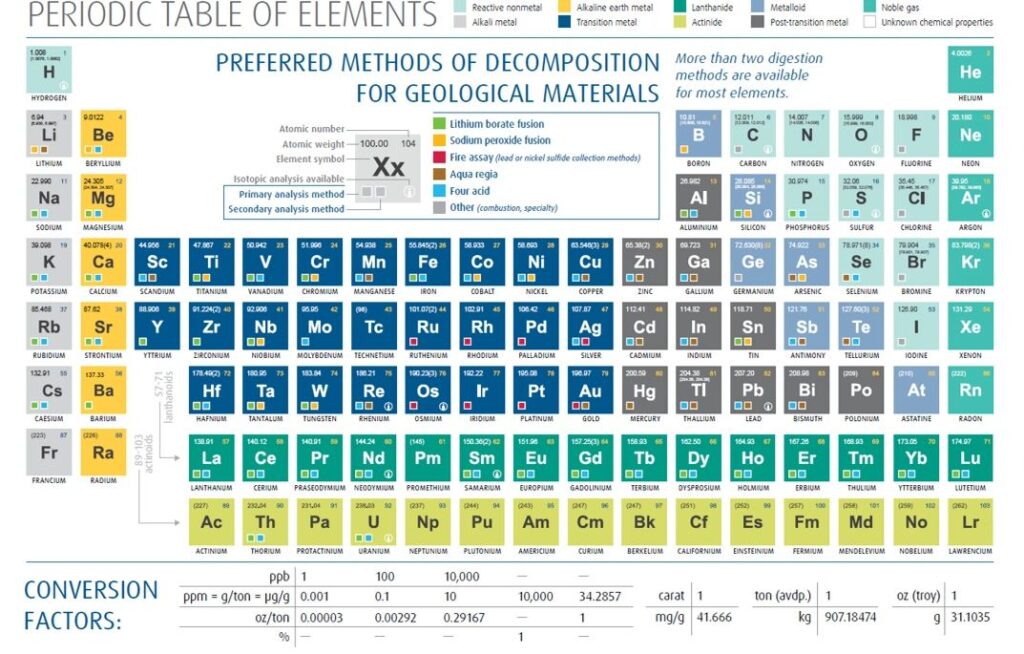
Perhaps a bit unconventional for these blog posts, but I want this to revolve front and center around this amazing resource I found from ALS Labs in the depths of my hard drive… a periodic table of the elements that contains information about the types of digestions required to liberate each element (note that photon assay is…
Read MoreOrientation Study: Residual Soil Geochemistry
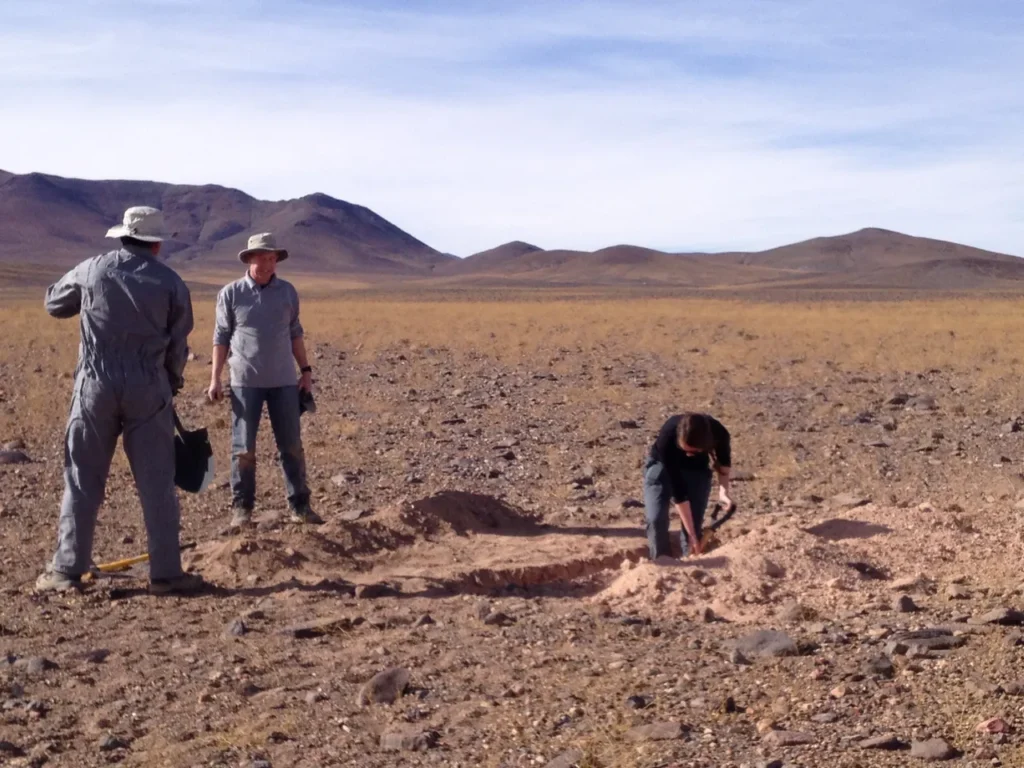
As discussed in our first installment, orientation studies should enable the selection of optimum field, laboratory and interpretation procedures. Ideally, these procedures should allow for the clear resolution of significant anomalous patterns, with as little overlap as possible between anomalous and background populations. Below is a list of some of the most important factors that…
Read MoreJanuary: A Month of Orientation Surveys
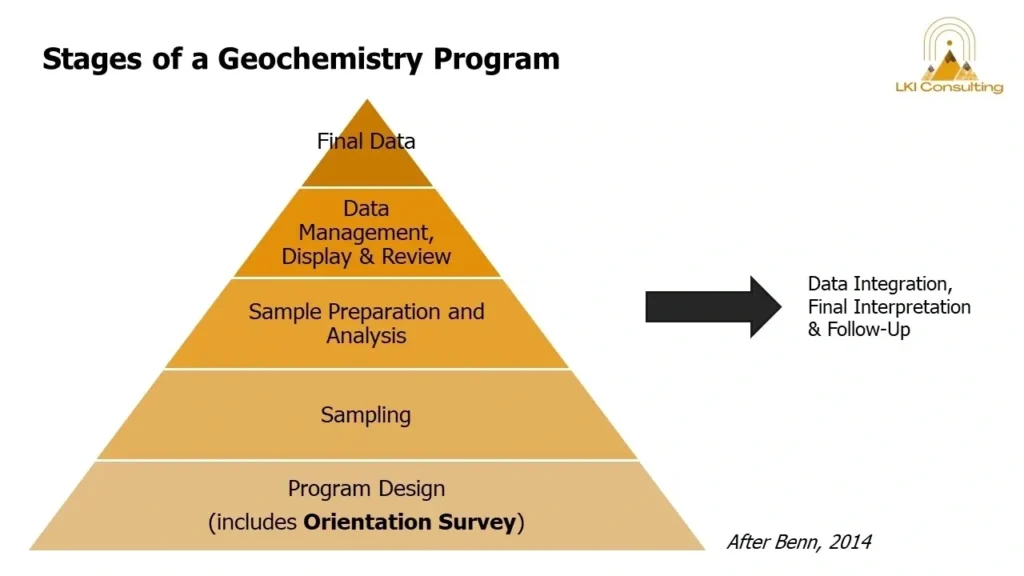
Orientation survey. Of course you *should* know what this term means… you think to yourself… Stop googling for half baked answers and stay tuned this January to our blog, where we are going to break down this term and show you how to put together some really simple programs that will ultimately return value to…
Read MorepXRF & QA/QC
Haven’t conducted a pXRF program in awhile? No worries, this post has you covered… to remind you to never ever forget to calibrate your equipment. Like any geochemical program, you’re also going to need to setup a rigorous QA/QC program complete with standards (matrix-matched certified reference material), blanks (pure quartz) and duplicates. QA/QC Theory Successful…
Read More