
A key aspect of geometallurgy is understanding what is the relationship of the mineral(s) of interest to all other minerals?
What is texture?
The characterization of mineral texture is a major concern for process mineralogists, as liberation characteristics of ore are intimately related to mineralogical texture.
What do we mean when we are talking about texture? We are not referring to things that have anything to do with touch-sensory, but rather thinking in terms of ‘does mineral 1 occur as fine-grained inclusions in mineral 2 or as coarse grains?’ If the former, mineral 1 cannot be liberated (this is problematic), but if the latter, it can be liberated (great!).
Ore texture, in particular grain size, controls the final particle size that must be achieved by comminution, or the reduction of solid materials from one average particle size to a smaller average particle size by crushing, grinding, cutting, vibrating, or other processes. This, in turn, controls the ultimate recoverability of minerals and metals.
The above concept is important because of economics… more finely intergrown ores must be milled to finer particle sizes to achieve mineral liberation, thereby causing higher energy consumption and operational expenditure (i.e., OPEX), as well as potentially producing chemically more reactive tailings.
Until recently, the characterization of texture in ore deposits has been more descriptive than quantitative. Quantitative characterization of texture in mineral particles is essential to improve and predict the performance of all processes involved in the liberation and separation of the mineral of interest and to achieve more accurate geometallurgical models.
Let’s take a look at two interesting examples:
Grain size and mineral associations
The setting is a Cu-sulfide system, where our Cu ore is likely hosted in chalcopyrite or bornite (amongst other more minor phases). Establishing which minerals are hosting the Cu is our first step; this concept we have talked about in a prior post and is called deportment.
Our next step is to investigate whether these sulfides contain inclusions of other minerals and what their texture is. For example, are there sphalerite inclusions in chalcopyrite? We can do this using instrumentation such as LA-ICP-MS, MLA, LIBS, and SEM.
The elemental data identified from pixels marked as sulfide minerals will then be used to determine intra-mineral and trace element chemistry. The knowledge of all deleterious elements and by- and co-product elements will impact mill and processing circuit design. In our Cu-sulfide project example there is potential for:
- Deleterious elements
- As with chalcopyrite
- Hg, Sb, and Pb with chalcopyrite and molybdenite
- Bi, As, Pb with sphalerite
- By- and co-products
- Au with chalcopyrite and molybdenite
- Ag with bornite
- Te, Co with chalcopyrite
- Zn, Mn, Co with sphalerite
Ultimately the correct identification of these textures will help us with project valuation.
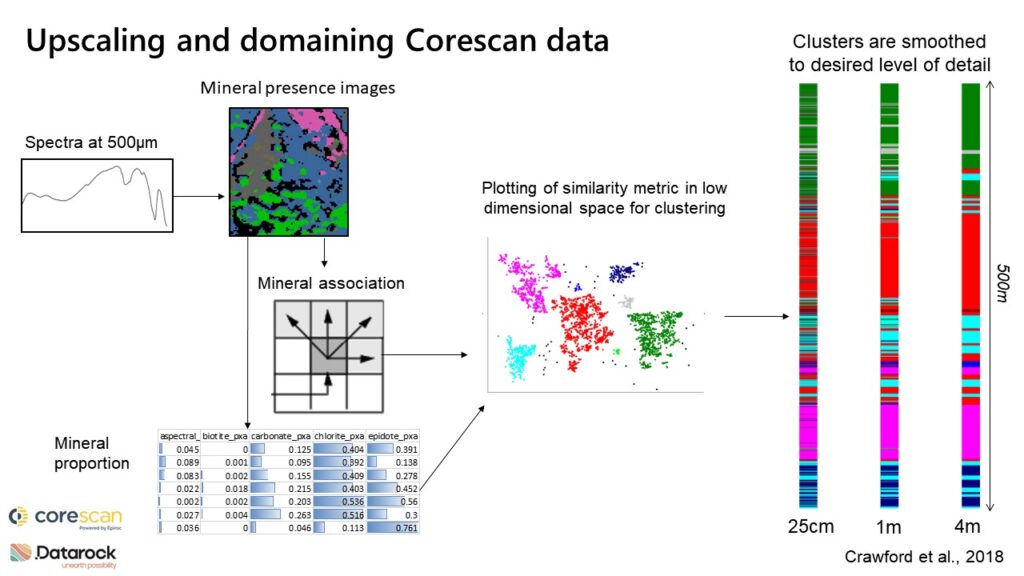
Ore and gangue mineral associations using hyperspectral core imaging
Applying hyperspectral imaging (HSI) to our exploration and mining programs enables us to look at the statistics of how pixels (i.e., minerals) are connected and spatially distributed at both the micro- and macro-scale.
Using HSI mineral maps, we can extract statistical measures of mineral texture, which then can be used to classify mineral texture in both supervised and unsupervised machine learning methodologies on the drillhole to ore body scale.
When metallurgical testwork results are linked to mineralogical and textural properties, proxies can be developed and calculated over entire HSI datasets (potentially over an entire mine!), and predictive processing behavior models can be developed.
The example below demonstrates a workflow by which quantitatively extracted textural information from an HSI dataset is used to generate clusters that could inform a geometallurgical model.
Texture, in summary
Texture is a key component to metal recovery and may make or break your project. Unfortunately, it is not something easily quantifiable from core logging data nor a parameter that is necessarily collected during exploration. As geochemists, we know that a high metal assay does not necessarily equal high value, but rather value can be dependent on the texture of the minerals hosting the metals and their association with other minerals.
References
- Crawford, B., Carmichael, T., Webb, L., (2018, February 22). Machine Learning Applications in Exploration and Mining [Short Course]. AI/Machine Learning Opportunities and Challenges for Minerals Exploration Short Course, AEGC, Sydney, NSW, Australia.
- Hunt, J. (2018, May 22-25). Geometallurgy Introduction [Short Course]. Geometallurgy Practical Short Course, University of British Columbia, Vancouver, BC, Canada.
- Klein, B., Wang, F. (2018, May 22-25). Rock Breakage and Ore Hardness [Short Course]. Geometallurgy Practical Short Course, University of British Columbia, Vancouver, BC, Canada.
- Scher, S., (2020, October 9-10). Domaining Continuous Hyperspectral Data for Geometallurgical Testwork Sample Selection [Presentation]. Chile Explore Conference, Santiago, Chile.